
Our VISION
is to drive continuous advancements in cardiac care to achieve superior
diagnostic accuracy, personalized treatment, and improved patient outcomes
through relentless research, and collaboration with medical experts,
by providing AI-based edge quality tools.
CadFlow application employs an advanced and custom-developed set of AI algorithms and tools to enable automatic coronarography image data analysis and SyntaxScore calculation. Working closely with cardiothoracic surgeons, cardiologists, and scientists, we have maximized the clinical viability of the product.
The CadFlow solution utilizes a modern microservice software architecture, with a RichUI application deployed in the Azure cloud. It facilitates interaction between custom components responsible for AI processing and DICOM data management. This allows scalability and flexibility for further application refinement. The development process followed agile principles, with extensive analysis of end-user requirements and valuable input from medical experts to ensure optimal design, functionality, security, and robustness.
Together with the CadFlow application an automated environment was developed to support the implementation of the SyntaxScore algorithm, providing repeatability, stability, and automation of data acquisition and processing, system testing, and elimination of manual actions. This enables independent testing of components and their interaction in a simulated environment, ensuring its robustness, reliability, automatic feedback loop integration, and agile development approach.
The custom-developed AI algorithm for SyntaxScore calculation includes DICOM study selection, automatic segmentation of cardiovascular structures, 3D reconstruction of coronary artery tree, stenosis detection and characterization, and scoring their contribution to SyntaxScore.
The microservices architecture allows visualization of each AI algorithm step’s results. Through the RichUI medical experts can review and verify each component result generated automatically, making necessary corrections if needed, and providing feedback for future enhancements of the AI algorithms. This approach ensures transparency and explainability for all decision-making processes, which is a crucial requirement for medical applications and reinforces trust in the system’s outputs.
CadFlow enables collaboration between the medical community and engineers to automate SyntaxScore calculation from coronarography DICOM image data. The system collects feedback for further improvement of AI algorithms and creates a ground truth reference database for future deep-learning applications. The flexible microservice architecture accommodates new requirements and supports ongoing algorithm development.
In summary, CadFlow is a powerful tool that brings together AI-driven SyntaxScore calculation, medical expertise, and cutting-edge microservices architecture, empowering the medical community to improve diagnostic accuracy and patient care.
Technologies
Languages
Java, Python, YAML
Tools
Docker, Helm, Kubernetes, Azure Cloud Services
Concepts
Domain Driven Design, Microservices, CI/CD, MLOps, Agile

Hospital DICOM Repos
- API for automated data collection from hospitals repositories
- Data ingestion, curation, labeling and preparation

ML Algorithms & CAD
- AI toolset for algorithms development
- AI based algorithms for SyntaxScore calculation, stenosis detection and characterization
- Direct decision support during coronarography
- Support for optimal therapy selection

Research Appliance
- Ready ground truth datasets
- Facilitation of manual and semi-automatic external data labeling
- API for development and testing own algorithms

Teleconsultation and Data Sharing
- Support for expert knowledge exchange through remote Computer-Aided Diagnosis and Teleconsultation System (Heart Teams)
Product
In the following figures, we present screens from CadFlow rich-UI application, each related to a separate AI microservice. A detailed description of each window is provided in figure captions.
Empowering Diagnosis and Treatment in
Coronary Artery Disease
The application is divided into independent microservices, according to the natural steps of coronarography data processing. Medical specialists are provided with insight into every step and the required level of explainability is ensured to build trust in medical community. Each step is transparent and can be manually corrected by medical doctors. Their feedback is collected to further improve AI algorithms and machine learning models, thus creating a reliable reference database for future deep-learning applications.
The Syntax Score calculation algorithm consist of the following steps:
1. Study selection
2. Series Selection
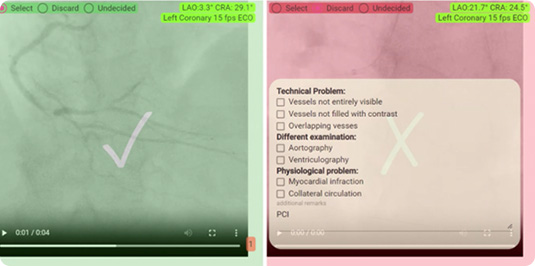
Rich-UI window for series selection. MD can indicate and verify the rejection criteria defined in technical and medical terms. The feedback from user interactions is collected and can enhance the algorithm for automatic series selection.
3. Frame selection
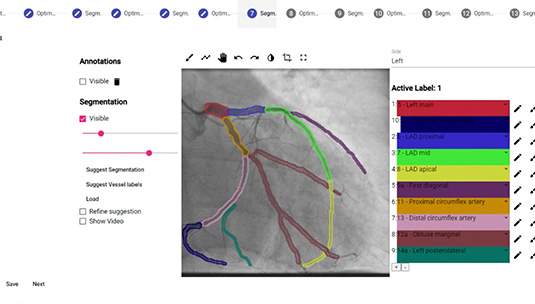
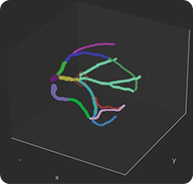
4. Coronary Artery Semantic Segmentation and Branch Identification
5. Stenosis Detection and Characterization
Rich-UI window for the lesion indication and characterization. First, the location of the stenosis is indicated which pops the form for its characterization. Only specific form inputs are available in accordance with previous automated indications and MD suggestions. This optimizes user interaction time. The feedback from user interactions is collected and can enhance algorithms.

A1


2D RCA projections with semantic segmentation
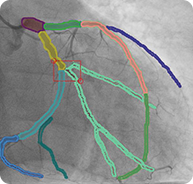
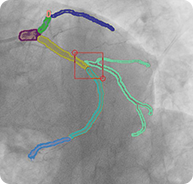
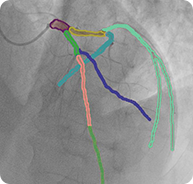
6. 3D Reconstruction of Coronary Artery Tree with Marked Stenosis Areas
A2

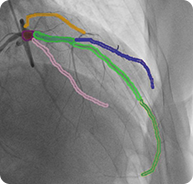
2D LCA projections with semantic segmentation
B

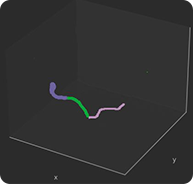
3D reconstruction from different 2D projections
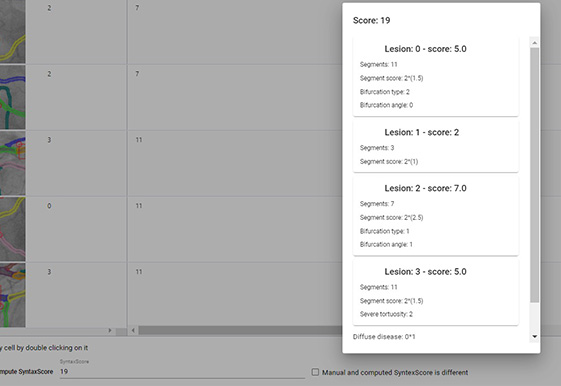
7. SyntaxScore Calculation
and Report Generation
Rich-UI window with an interactive table of all lesions’. With this type of presentation, all lesions can be comprehensively verified and edited, which includes changing specific parameters, assessing the same lesions indicated on different projections, and merging minor changes into one significant lesion. Next, the SyntaxScore can be automatically calculated which pops the window indicating each lesion contributing factors to the final score (in this example case it is equal to 19, marked with red border). This provides explainability required by MDs (factors influencing the decision).
VIDEO
CadFlow rich-UI application demo
Product
Specific algorithms required to build a workflow for SyntaxScore calculation were designed (A1-A6)
A1. Data series and optimal frame selection
A2. Coronary artery segmentation
A3. Branch identification
A4. 3D coronary artery tree reconstruction
A5. Stenosis identification and lesion characterization
A6. Syntax score calculation and final report generation
Additional requirements for the algorithms and quality measures were indicated in collaboration with medical doctors. AI algorithms for SyntaxScore calculation were designed, developed, and validated both on reference datasets, and based on MD feedback.
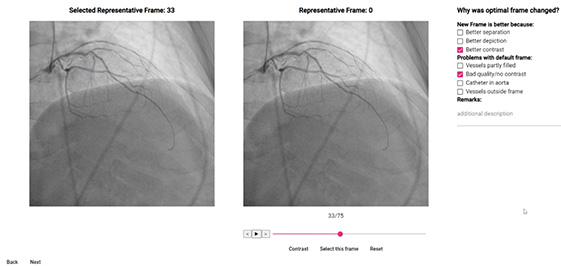
Two separate tasks are involved: developing an algorithm for series selection and for the optimal frame selection. For clarification, a single study consists of multiple series, i.e., 2D video files (acquired at different projection angles, and with different settings stored in DICOM metadata) and each series consists of multiple frames. The first task was to extract these relevant for SyntaxScore calculation. This was done by first establishing selection criteria by MD, and then subsequently refined by feedback received from their rejection justifications via dedicated forms incorporated in rich-UI app (Figure 4). A similar approach was used in the case of optimal frame selection. First AI-suggested optimal frame was chosen based on DICOM metadata and image feature analysis. Then the algorithm was iteratively refined by introducing conclusions from MD justifications why the suggested optimal frame was changed, again via dedicated forms incorporated in rich-UI app. The AI-driven workflow significantly reduced the time needed to select the relevant series and optimal frames.
Algorithm development required balancing accuracy with computational efficiency. The first version of an algorithm for coronary artery segmentation was implemented successfully and with very good validation results (DICE score 73%, Accuracy 99%). Next, we provided two significant refinements. The first concerned the introduction of an interobserver variability factor due to the expected complexity of the task. Three experts were asked to perform manual segmentations independently, and as expected their results varied significantly. Embedding this information as a probability map provides additional information to the training process, reducing overfitting and increasing the flexibility of the model. The second refinement concerned the elimination of false positive segmentation results. The first algorithm falsely included no-vessel vessel-like structures i.e. stitches and catheters. We addressed this problem by designing and developing a dedicated classification model. This enabled us to accurately identify vessels and eliminate false positives, resulting in more reliable segmentation results [1]. Through rich-UI interface MD can correct the AI-proposed coronary artery segmentation.
[1] Our paper entitled A novel framework for differentiating vessel-like objects in coronarography images , IEEE EMBC 2023 proceedings.
https://arinex.com.au/EMBC/pdf/full-paper_1180.pdf
The branch identification algorithm automatically identifies specific vessel branches and names them in accordance with their anatomical descriptions. The algorithm consists of several steps, including the detection of vessel centerlines, the representation of coronary arteries in a graph-like manner, the detection of vessel bifurcations, and finally the identification of vessel branches. The quality of each subsequent step is influenced by the quality of the previous step. For this reason, algorithm steps were developed using an iterative loop refinement approach. As a result, the development efforts led to successful algorithm development and validation. Through a rich-UI interface MD can correct the AI proposed segment identification.
The reconstruction is performed based on 2D projections acquired during coronarography examination, each in principle at different projection angles and with different settings stored in DICOM metadata. The developed algorithm incorporates geometrical properties of the 2D images, and the information derived from branch identification (i.e. coordinates of the transition between successive segments identified in different projections, centreline coordinates, branch identifiers). First, the 2D images are transformed into the 3D coordinate system, next 3D vessel centerline is constructed by interpolating coordinates derived from single transformed images and taking into consideration the number of projections available per each segment, then the local vessel radius is calculated to maintain a realistic representation of various vessel parts including stenosis, finally a mesh is calculated, and 3D reconstruction is achieved.
The stenosis identification algorithm makes use of centerline points obtained during step A3, and local radius disappearances. Both geometrical and image features are next compared to the model features to detect any local variances and verify whether a particular centerline point is part of the stenosis or not. Ultimately, the stenosis length can be determined. The algorithm for stenosis characterization is based on a thorough analysis of parameters included in SyntaxScore calculation: qualitative (e.g. thrombosis, tortuosity, calcification), geometrical (e.g. stenosis length, bifurcation angle) and anatomical (e.g. segments involved in stenosis, next visible segment after a stenosis). To categorize stenosis qualitatively, a model based on image features is used. Hand-crafted features were designed and selected to feed the algorithm. To determine stenosis geometric characterization local geometric dependencies derived from previous steps are used. To provide anatomical dependencies, results of segment identification are used. As a result. the algorithm for stenosis identification and characterization was developed. Through rich-UI interface MD can correct the AI proposed stenosis characterization. Their feedback is collected through rich-UI and can be used for further model training.
To develop the Syntax Score calculation algorithm, an extensive analysis of the necessary parameters was performed. This included identifying them and finding a way to generate them from the available algorithms and data. It was necessary to understand some of the parameters more deeply. The algorithm for SyntaxScore calculation takes into account stenosis characterization scored depending on its location determined by branch identification. Each stenosis is located and characterized on at least two independent projections. The proposed algorithm complies with discrepancies in their descriptions by selecting the most severe values. Since SyntaxScore calculation is a complex task that requires medical interpretation and experience in clinical coronarography data analysis, the algorithm development process was conducted in close collaboration with MD. The algorithm was iteratively refined until we covered all differences between AI interpretation and MD scores. As a result, the calculated SyntaxScore value is exactly the same in each instance verified.